Editing rows
Adding rows
To add one or more rows to your layout, click on the Add row button.
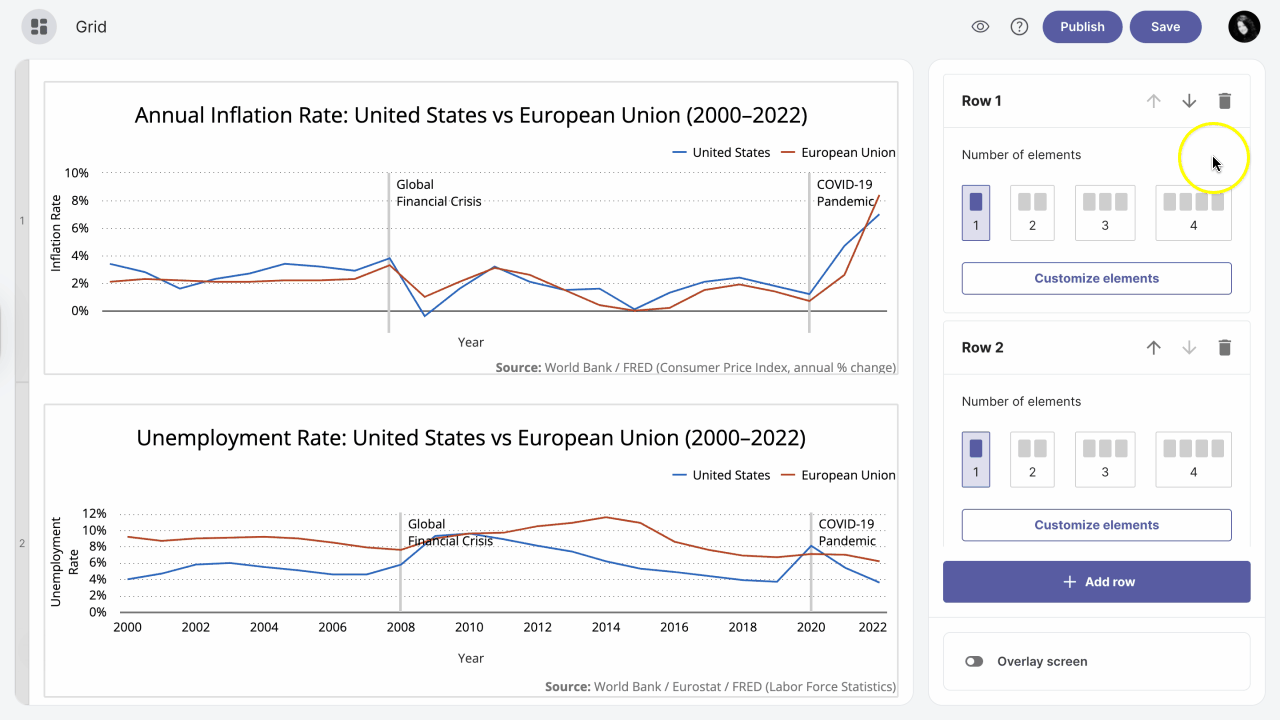
Maximum number of rows is four.
The minimum number of elements in a row is one and the maximum is four. Choose which option best suits your layout.
Move rows
If you want to reorder your rows, click on the Move Row Up arrow_upward or Move Row Down arrow_downward depending on where you want to move the row.
Delete rows
You can simply delete rows by clicking the Delete Row button delete in the upper right corner of the edit row box.