Transpose data
In Charts, data is organized in rows and columns but you can transpose it by switching columns and rows. This will result in data in rows switching places with data in columns.
You can transpose data in two instances:
- While creating a new chart by uploading your data
- While editing existing chart data
The transpose option is not allowed for Fred and StatCan charts and if the chart has the auto update option turned on.
Transpose is not allowed if you have more than 196 rows or more than 197 columns in your data.
Transpose data while creating a new chart
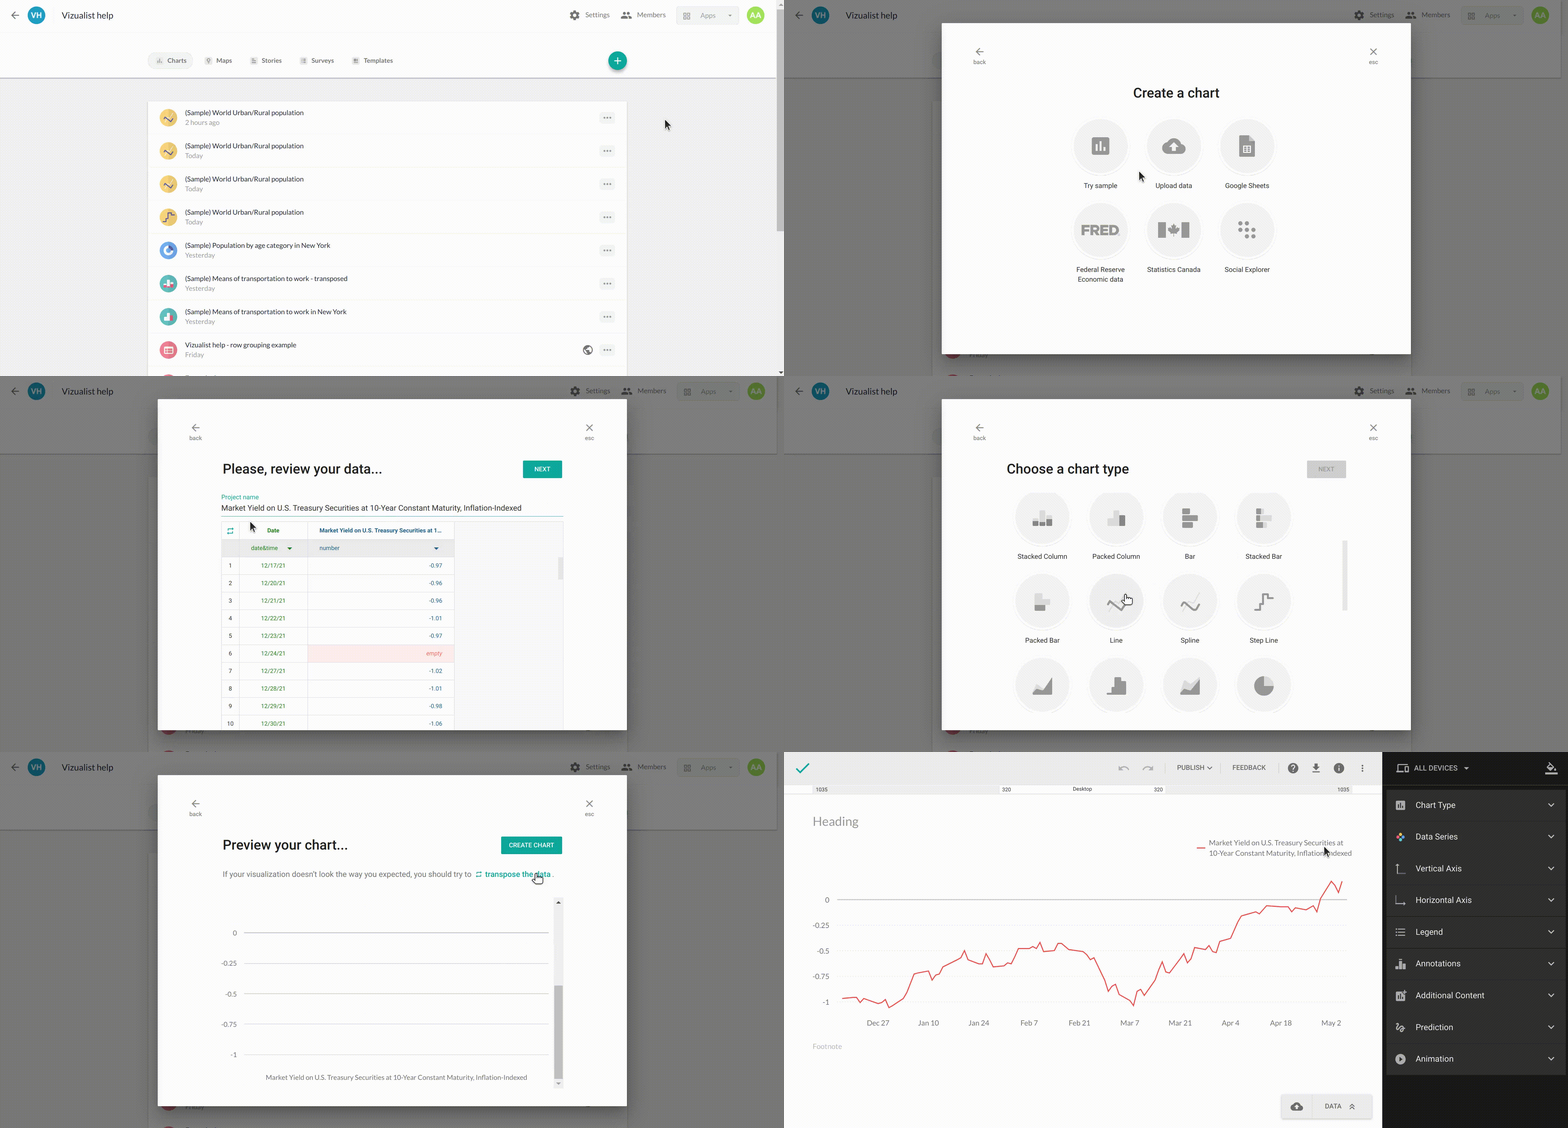
Transposing data when creating a new chart is possible for charts that have Upload data, Social explorer, or Google Sheets data. We will show you an example of a chart with Upload data, and the same applies for all others.
- Go to Vizualist dashboard.
- In the upper-right corner, click the add icon
.
- Choose Charts.
- Click Upload data.
- Click browse to select the file from your computer. or
Paste your data in Paste your copied data here… field. or
Drag and drop the file from your computer anywhere on the screen.
Note: Charts supports CSV, XLS, and XLSX file extensions. - Set the chart name and click the transpose icon
 in the upper-left corner of data grid to transpose data.
At this point, you can also change the type of columns if needed.
- Click Next.
- Select a chart type and click Next.
- If you're not happy with the chart in the preview window, you can click
transpose the data again and click Create chart.

Transpose data while editing the existing chart data
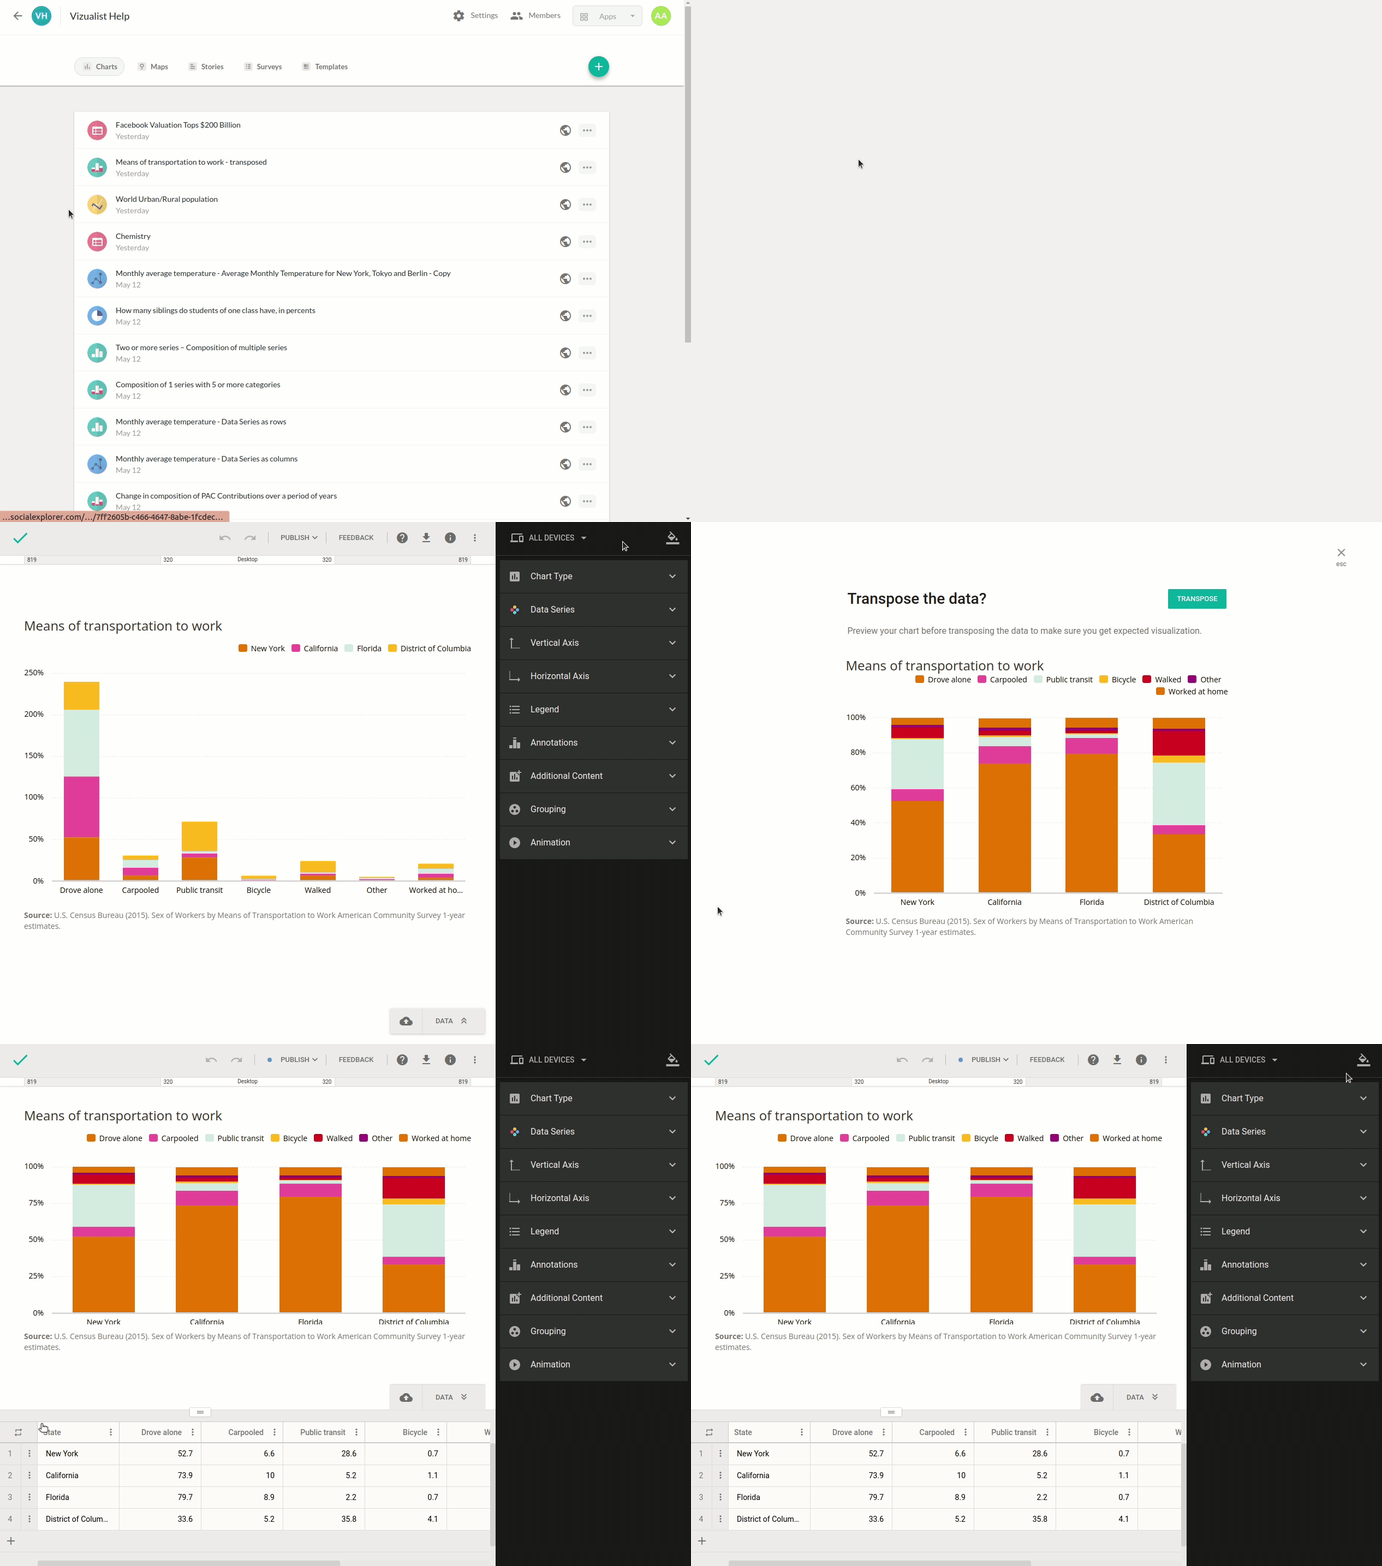
You can transpose data even after you've created a chart.
- Open the chart you want to edit.
- In the upper-right corner, click Edit.
- In the bottom-right corner, click Data.
- In the upper-left corner of the data grid, click
 .
. - If you're happy with the result displayed in the preview window, click Transpose. To cancel, click X in the upper-right corner, or press Esc on your keyboard.

 in the upper-left corner of data grid to transpose data.
 transpose the data again and click Create chart.