Publish, share and update your chart
In our previous guide, we went through setting up your very first chart and we covered the basic customization options. However, we still haven't covered all the other things you can do when you finish working on a chart. For starters, at some point or another, you'll want to share a chart you create with other people.
Preparing your chart for publishing
Even though you finished working on a chart, there's still one thing you should do before publishing and sharing your chart – sorting out the metadata. Metadata is all the information about the chart, such as title and description, and not the actual data inside the chart.
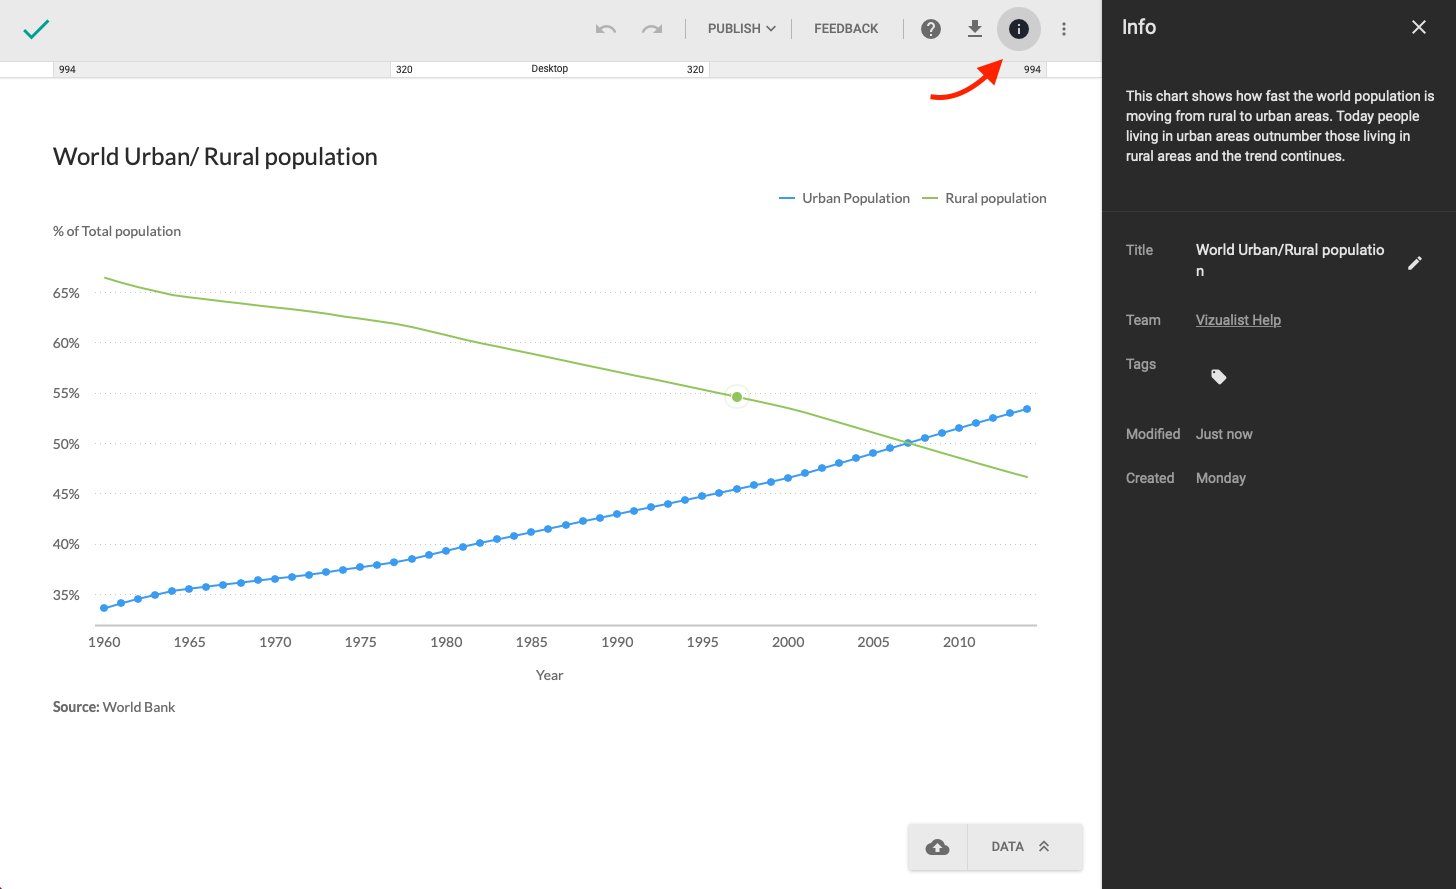
- At the top of the screen, click the info button
.
- In the right-hand sidebar, enter the description.
- Next to the title field, click the edit icon
.
- Enter tags that relate to your chart.
- Click X in the upper-right corner to return to the previous screen.
Publishing your charts
Publishing a chart is the first step you need to make to share a chart with people.
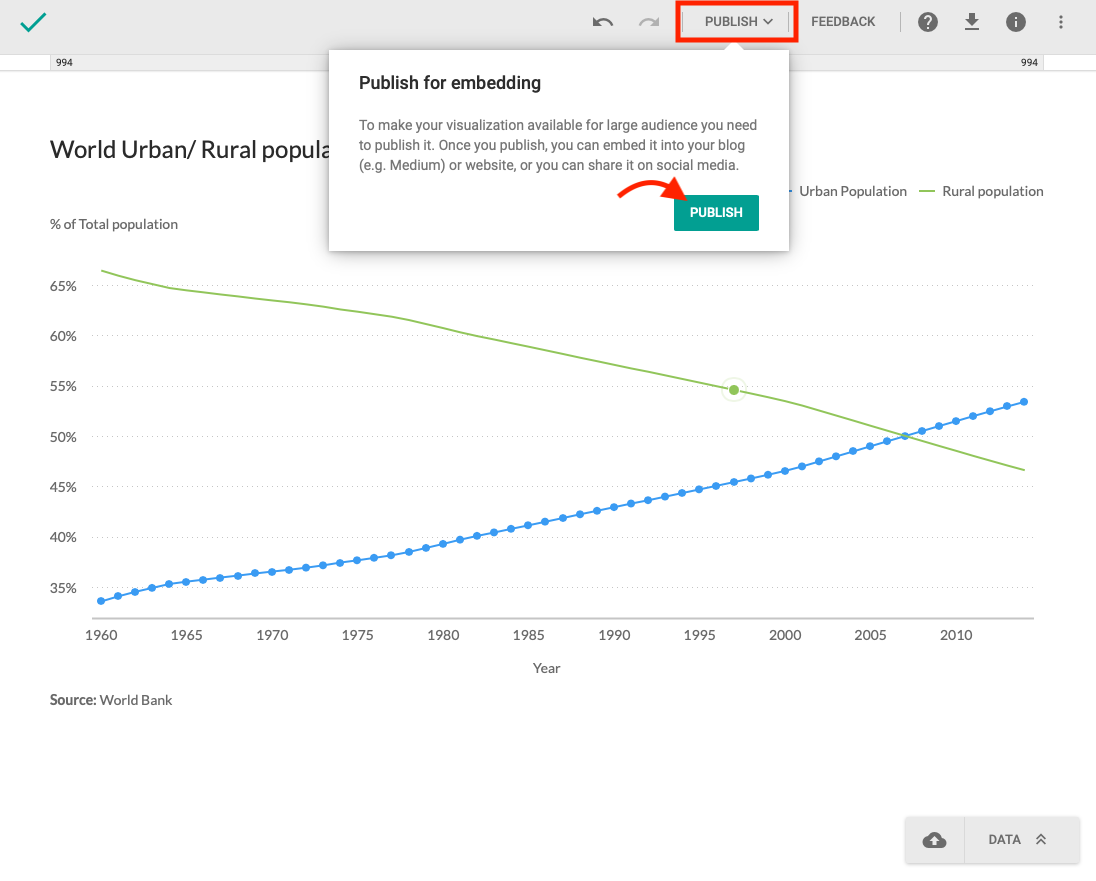
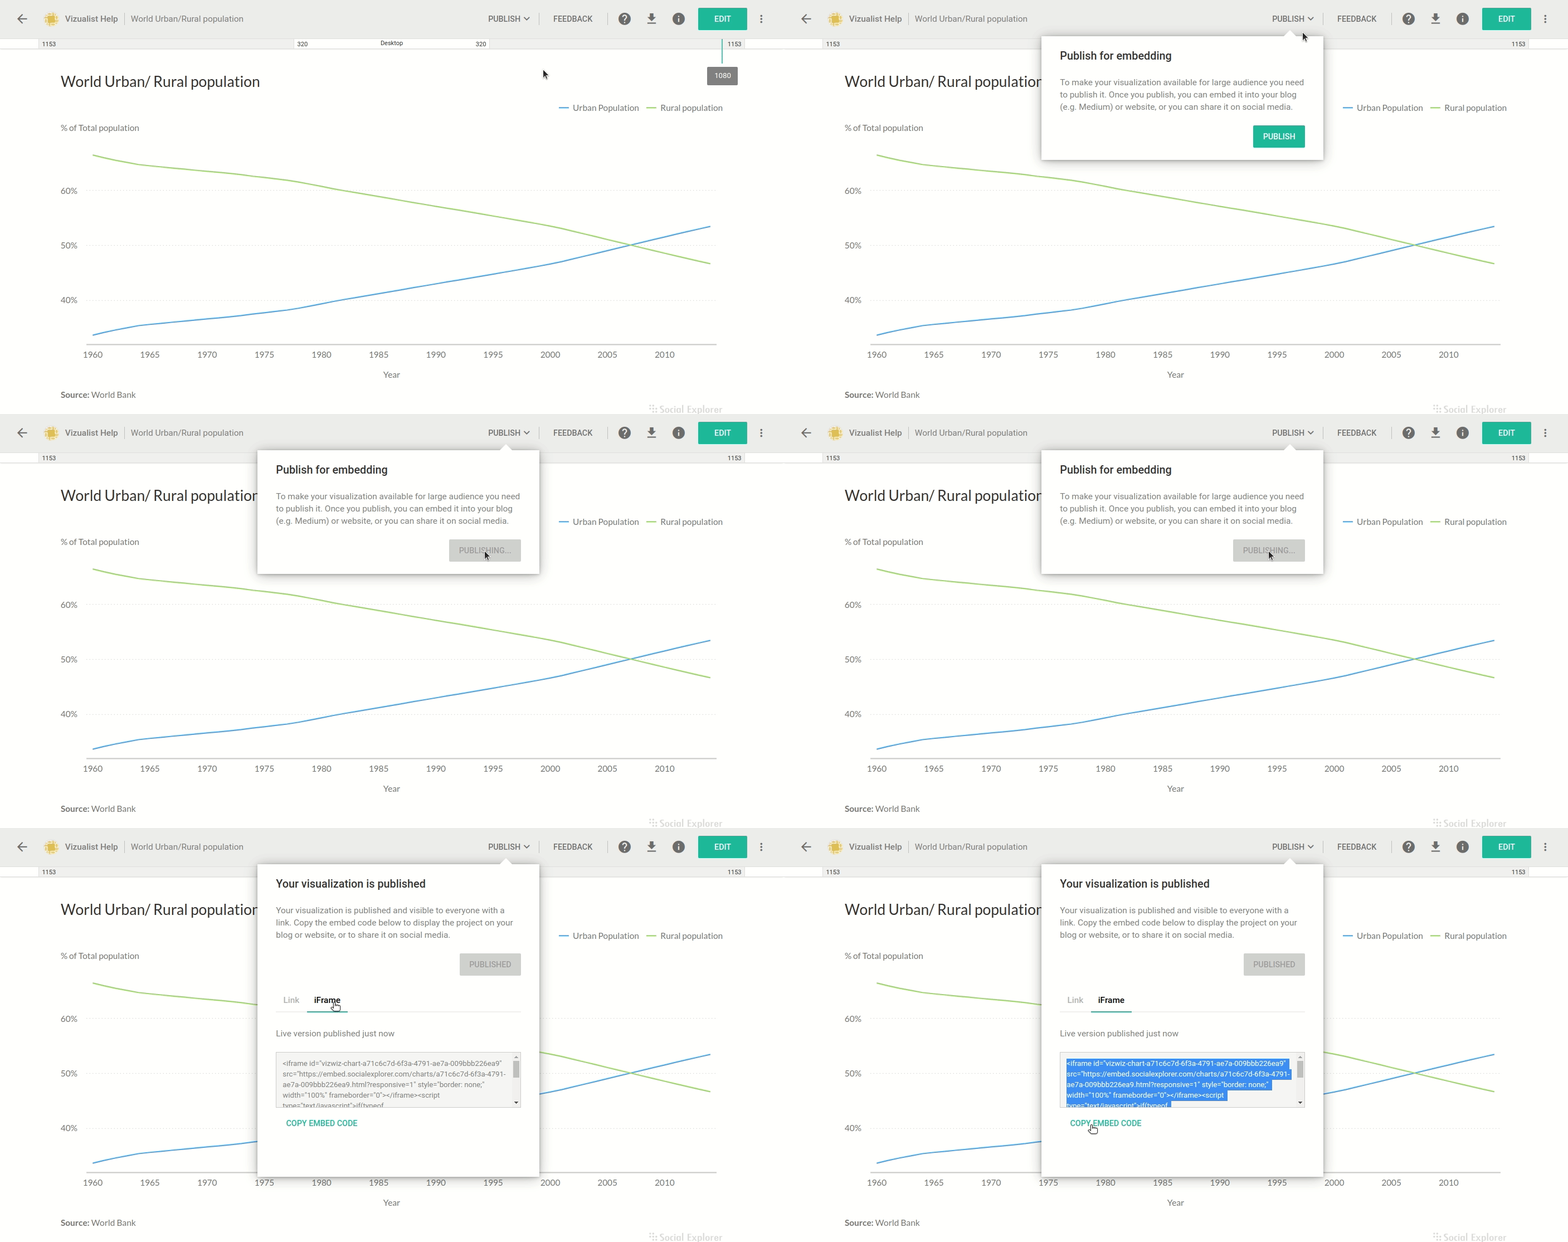
- At the top of the screen, click Publish.
- In the pop-up window, confirm by clicking Publish.
Sharing and embedding your charts
You've just published your chart. As of right now, it's still not visible anywhere on the web. To make it accessible, you will need to share or embed your chart.
Sharing a chart
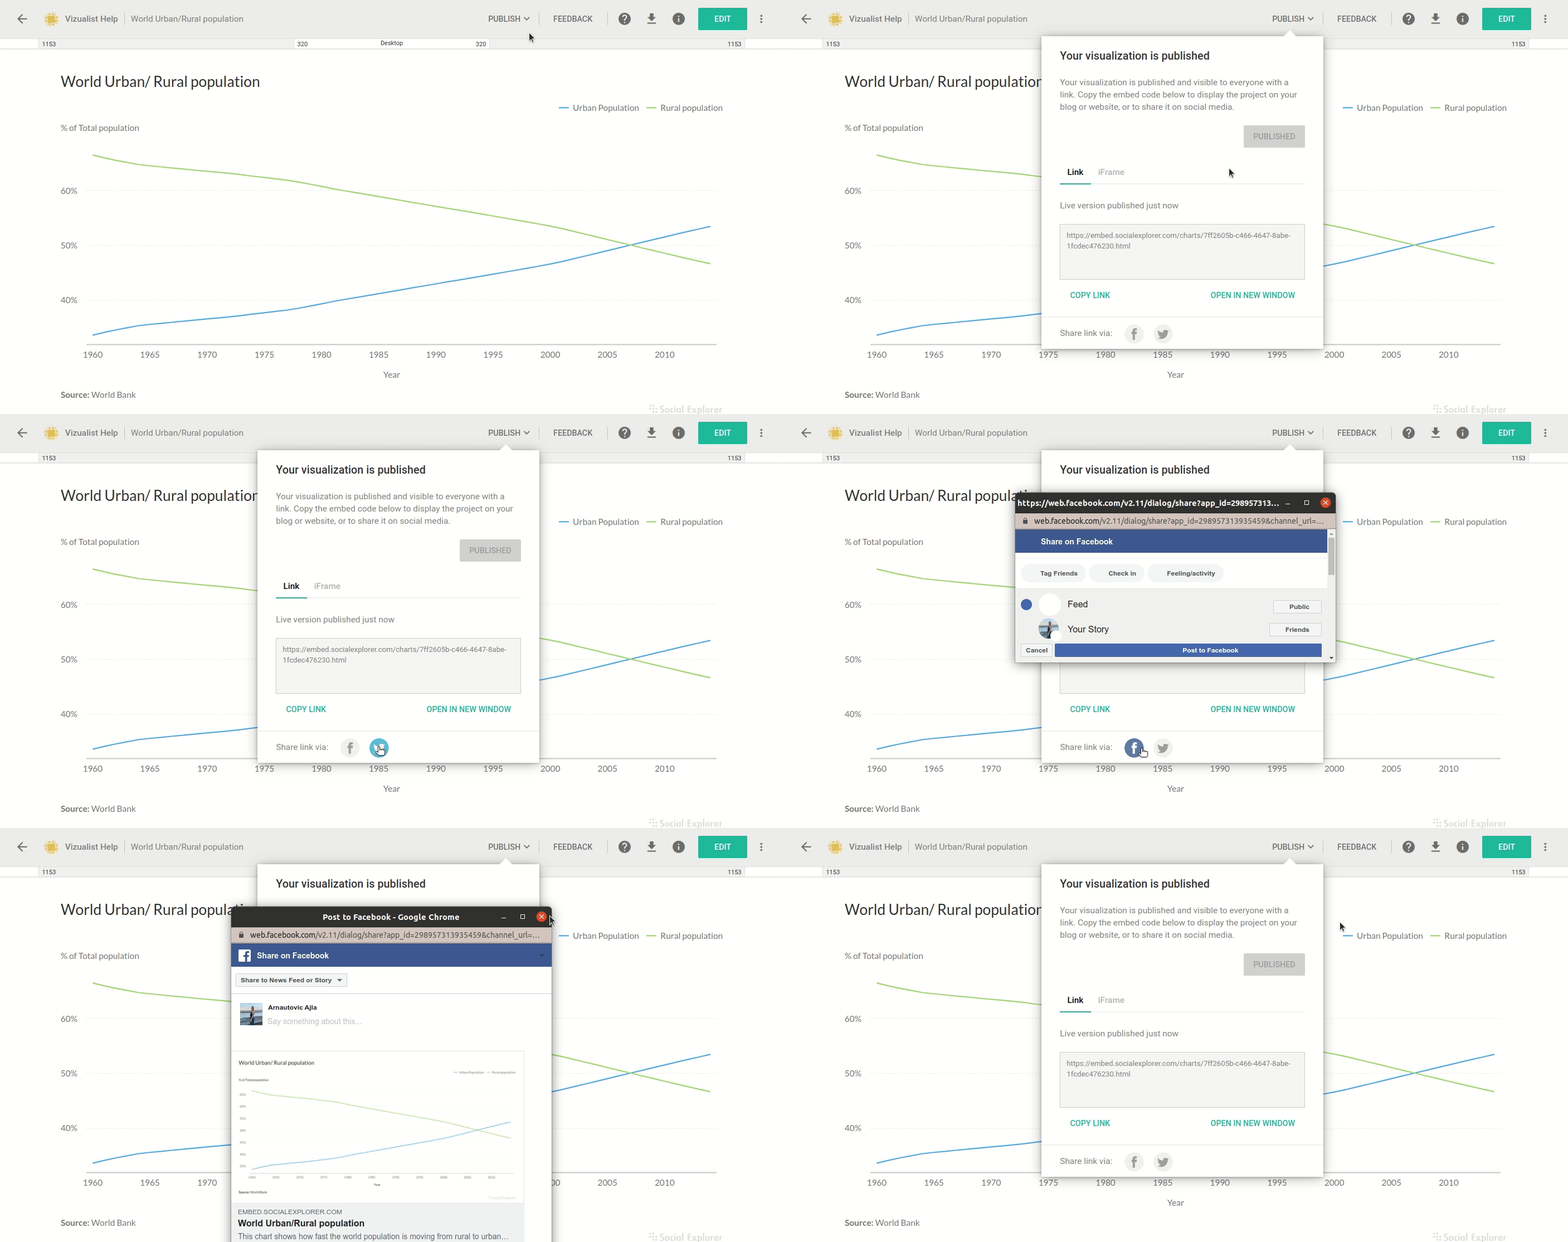
- At the top of the screen, click Publish.
Since your chart has already been published, the pop-up window will be slightly different from the window in the previous step.
- To send the direct link to your chart, click Copy link (or select the link in the link field and copy it) and paste it in an email or a message.
- To share the chart on social media, click the icon of the social network you want to share your chart to.
Embedding a chart
- At the top of the screen, click Publish.
- Click iFrame.
- Click Copy embed code.
- Paste the link to your blog or website.
Updating your charts
Charts allows you to revisit every chart you've created, even the ones you already published and embedded, and update them. You can update the data or just play around with the colors, without affecting the embedded version of the chart. All the changes will be visible only to you, and when you decide to allow your audiences to view the latest version of the chart, you'll need to republish it.
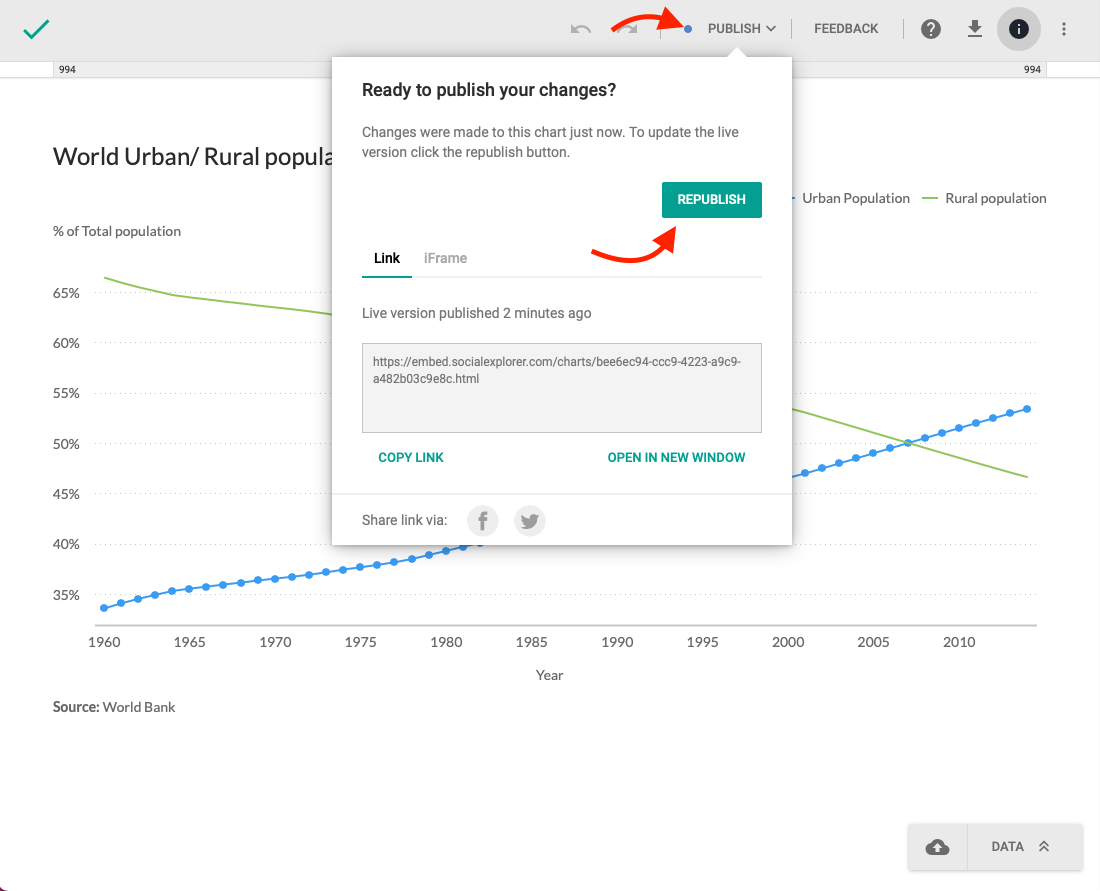
A blue dot next to Publish indicates that there are changes not visible to your audience when you update any chart you already published. This dot will also be visible next to the name of the chart on the homepage, so you can keep track of all the charts with changes not visible to your audience.
Here's what you need to do to make sure you audiences are seeing the latest version of the chart.
- At the top of the screen, click Publish.
- To confirm you want to update the live version of your chart, click Republish.
Once you republish the chart, all the changes will be visible to all your audiences, and you don't need to send or embed a new link.
